Coventry City Council elections are generally held three years out of every four, with a third of the council being elected each time. Coventry City Council is the local authority for the metropolitan borough of Coventry in the West Midlands, England. Since the last boundary changes in 2004, 54 councillors have been elected from 18 wards.[1]
Political control[edit]
From 1889 to 1974 Coventry was a county borough, independent of any county council.[2] Under the Local Government Act 1972 it had its territory enlarged and became a metropolitan borough, with West Midlands County Council providing county-level services. The first election to the reconstituted city council was held in 1973, initially operating as a shadow authority before coming into its revised powers on 1 April 1974. West Midlands County Council was abolished in 1986 and Coventry became a unitary authority. Political control of the council since 1974 has been held by the following parties:[3][4]
| Party in control | Years | |
|---|---|---|
| Labour | 1974–1977 | |
| Conservative | 1977–1979 | |
| Labour | 1979–2003 | |
| No overall control | 2003–2006 | |
| Conservative | 2006–2008 | |
| No overall control | 2008–2010 | |
| Labour | 2010–present | |
Leadership[edit]
The role of Lord Mayor of Coventry is largely ceremonial, with political leadership provided by the leader of the council. The leaders since 1974 have been:[5]
| Councillor | Party | From | To | |
|---|---|---|---|---|
| Arthur Waugh[6] | Labour | 1 Apr 1974 | Apr 1977 | |
| Gilbert Richards[7][8] | Conservative | Apr 1977 | May 1979 | |
| Arthur Waugh[9] | Labour | May 1979 | 1983 | |
| Peter Lister[10] | Labour | 1983 | 1988 | |
| Jim Cunningham[11] | Labour | 1988 | 1992 | |
| Brian Clack[12] | Labour | May 1992 | 14 Nov 1996 | |
| John Fletcher | Labour | 1996 | May 2000 | |
| Nick Nolan[13] | Labour | May 2000 | May 2003 | |
| John Mutton | Labour | May 2003 | Jun 2004 | |
| Ken Taylor[14] | Conservative | Jun 2004 | 20 May 2010 | |
| John Mutton | Labour | 20 May 2010 | 16 May 2013 | |
| Ann Lucas | Labour | 16 May 2013 | 19 May 2016 | |
| George Duggins | Labour | 19 May 2016 | ||
Council elections[edit]
- 1998 Coventry City Council election
- 1999 Coventry City Council election
- 2000 Coventry City Council election
- 2002 Coventry City Council election
- 2003 Coventry City Council election
- 2004 Coventry City Council election (whole council elected after boundary changes took place)[1][15]
- 2006 Coventry City Council election
- 2007 Coventry City Council election
- 2008 Coventry City Council election
- 2010 Coventry City Council election
- 2011 Coventry City Council election
- 2012 Coventry City Council election
- 2015 Coventry City Council election
- 2016 Coventry City Council election
- 2018 Coventry City Council election
- 2019 Coventry City Council election
- 2021 Coventry City Council election
- 2022 Coventry City Council election
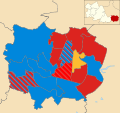
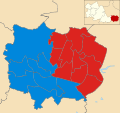
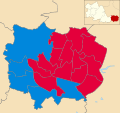
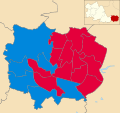
Borough result maps[edit]
2004 results map
2007 results map
.svg.png)
2008 results map
.svg.png)
2010 results map
.svg.png)
2011 results map
2018 results map
2021 results map


.svg)
.svg)
.svg)


By-election results[edit]
1993-1997[edit]
| Party | Candidate | Votes | % | ±% | |
|---|---|---|---|---|---|
| Labour | 1,674 | 49.0 | |||
| Conservative | 953 | 27.9 | |||
| Militant Labour | 535 | 15.6 | |||
| Liberal Democrats | 255 | 7.5 | |||
| Majority | 721 | 21.1 | |||
| Turnout | 3,417 | 28.9 | |||
| Labour hold | Swing | ||||
1997-2001[edit]
| Party | Candidate | Votes | % | ±% | |
|---|---|---|---|---|---|
| Labour | 4,801 | 63.7 | -7.2 | ||
| Conservative | 1,600 | 21.2 | +2.4 | ||
| Liberal Democrats | 1,136 | 15.1 | +4.8 | ||
| Majority | 3,201 | 42.5 | |||
| Turnout | 7,537 | 62.0 | |||
| Labour hold | Swing | ||||
| Party | Candidate | Votes | % | ±% | |
|---|---|---|---|---|---|
| Conservative | 1,741 | 61.8 | +11.9 | ||
| Labour | 673 | 23.9 | -7.8 | ||
| Liberal Democrats | 360 | 12.8 | -5.6 | ||
| Socialist Alliance | 44 | 1.6 | +1.6 | ||
| Majority | 1,068 | 37.9 | |||
| Turnout | 2,818 | 22.2 | |||
| Conservative hold | Swing | ||||
2001-2005[edit]
| Party | Candidate | Votes | % | ±% | |
|---|---|---|---|---|---|
| Labour | 2,998 | 46.9 | -5.2 | ||
| Conservative | 2,146 | 33.6 | -23.2 | ||
| Liberal Democrats | 987 | 15.5 | +13.9 | ||
| Unknown | 257 | 4.0 | +4.0 | ||
| Majority | 852 | 13.3 | |||
| Turnout | 6,388 | ||||
| Labour hold | Swing | ||||
| Party | Candidate | Votes | % | ±% | |
|---|---|---|---|---|---|
| Labour | Tony Skipper | 873 | 53.5 | +2.2 | |
| Liberal Democrats | Peter Simpson | 442 | 27.1 | +11.8 | |
| Conservative | Gary Ridley | 316 | 19.4 | -8.4 | |
| Majority | 431 | 26.4 | |||
| Turnout | 1,631 | 13.0 | |||
| Labour hold | Swing | ||||
2006-2011[edit]
| Party | Candidate | Votes | % | ±% | |
|---|---|---|---|---|---|
| Labour | Catherine Elizabeth Miks | 1,366 | 53.9 | -3.3 | |
| Conservative | Jaswant Singh Birdi | 563 | 22.2 | -0.1 | |
| Socialist Alternative | Robert McArdle | 254 | 10.0 | +3.6 | |
| BNP | Keith Oxford | 149 | 5.9 | +0.2 | |
| Green | Laura Vesty | 114 | 4.5 | -3.2 | |
| Liberal Democrats | Mark Edward Widdop | 79 | 3.1 | N/A | |
| Majority | 803 | 31.7 | |||
| Turnout | 2,532 | 18.51 | |||
| Labour hold | Swing | ||||
2016–2021[edit]
| Party | Candidate | Votes | % | ±% | |
|---|---|---|---|---|---|
| Labour | Rupinder Singh | 1,237 | |||
| Conservative | Ellane Francoise Yebkal | 344 | |||
| UKIP | Harjinder Singh Sehmi | 290 | |||
| Green | Aimee Challenor | 165 | |||
| Liberal Democrats | Christopher Mark Glenn | 124 | |||
| Majority | 893 | ||||
| Turnout | 2,160 | ||||
| Labour hold | Swing | ||||
| Party | Candidate | Votes | % | ±% | |
|---|---|---|---|---|---|
| Conservative | Mattie Heaven | 1,560 | 53 | ||
| Liberal Democrats | James Frederick Morshead | 634 | 22 | ||
| Labour | Abdul Jobbar | 544 | 19 | ||
| Brexit Party | George Stuart Ronald Beamish | 193 | 7 | ||
| Majority | 926 | ||||
| Turnout | 2,948 | ||||
| Conservative hold | Swing | ||||
| Party | Candidate | Votes | % | ±% | |
|---|---|---|---|---|---|
| Labour | Gurdev Singh Hayre | 639 | 53 | ||
| Conservative | Gurdeep Singh Sohal | 350 | 29 | ||
| Green | Chrissie Lynn Brown | 120 | 10 | ||
| Socialist Alternative | Jane Elizabeth Nellist | 101 | 8 | ||
| Majority | 289 | ||||
| Turnout | 1,210 | ||||
| Labour hold | Swing | ||||
2022–2026[edit]
| Party | Candidate | Votes | % | ±% | |
|---|---|---|---|---|---|
| Labour | Seyi Agboola | 934 | 36 | ||
| Conservative | Amarjit Singh Khangura | 765 | 30 | ||
| Coventry Citizens | Paul Nichalos Cowley | 746 | 29 | ||
| ADF | Marianne Angela Fitzgerald | 91 | 4 | ||
| TUSC | Michael James Morgan | 46 | 2 | ||
| Turnout | 2,582 | ||||
| Rejected ballots | 20 | ||||
| Labour hold | Swing | ||||
References[edit]
- ^ a b "The City of Coventry (Electoral Changes) Order 2003", legislation.gov.uk, The National Archives, SI 2003/2507, retrieved 10 September 2022
- ^ "Coventry Municipal Borough / County Borough". A Vision of Britain through Time. GB Historical GIS / University of Portsmouth. Retrieved 10 September 2022.
- ^ "Compositions calculator". The Elections Centre. Retrieved 10 August 2022.
- ^ "Coventry". BBC News Online. 19 April 2009. Retrieved 7 May 2010.
- ^ "Council minutes". Coventry City Council. Retrieved 10 September 2022.
- ^ Grimmer, Geoffrey (20 March 1974). "Ex-Lord Mayor head of Labour group in council". Coventry Evening Telegraph. p. 3. Retrieved 11 September 2022.
- ^ Grimmer, Geoffrey (20 April 1977). "Coventry's Lord Mayor dies: Labour lose control". Coventry Evening Telegraph. p. 6. Retrieved 11 September 2022.
- ^ "Council leader urges parties to co-operate". Coventry Evening Telegraph. 20 May 1977. Retrieved 11 September 2022.
- ^ "New council chief fears budget cuts". Coventry Evening Telegraph. 15 May 1979. p. 17. Retrieved 10 September 2022.
- ^ Arnot, Chris (19 June 2002). "Peter Lister". The Guardian. Retrieved 10 September 2022.
- ^ "Can't-lose Labour set for in-fighting". Birmingham Daily Post. 5 May 1992. p. 4. Retrieved 10 September 2022.
- ^ "Council leader gave his all for others". Birmingham Daily Post. 16 November 1996. p. 4. Retrieved 10 September 2022.
- ^ "City has been in great Nick". Coventry Live. 1 May 2003. Retrieved 10 September 2022.
- ^ "Former Coventry City Council leader receives OBE". Coventry Live. 23 November 2010. Retrieved 10 September 2022.
- ^ "Coventry council". BBC News Online. Retrieved 7 May 2010.
- ^ "Tony's win keeps Labour hold". Coventry Evening Telegraph. 21 September 2001. p. 5.
- ^ "Notice of By-election". Coventry City Council. 1 September 2011. Archived from the original on 23 July 2012. Retrieved 17 September 2011.
- ^ "Statement of Persons Nominated". Coventry City Council. 9 September 2011. Archived from the original on 23 July 2012. Retrieved 17 September 2011.
- ^ "Statement of results". Coventry City Council. 7 October 2011. Retrieved 8 October 2011.
- ^ "Labour win by-election after deputy leader's death". Coventry Telegraph. 13 February 2016. p. 8.
- ^ "Election results for Wainbody". Coventry City Council. 5 September 2019. Retrieved 8 September 2019.
- ^ "Election results for Upper Stoke". Coventry City Council. 19 March 2020. Retrieved 2 May 2020.
- ^ "Election results for Binley and Willenhall". Coventry City Council. 14 July 2022. Retrieved 21 July 2022.
External links[edit]
| Birmingham | |
|---|---|
| Coventry | |
| Dudley | |
| Sandwell | |
| Solihull | |
| Walsall | |
| Wolverhampton | |
| West Midlands County Council | |
| Mayor | |
| |
